Lab Values
Knowing these lab values and knowing what they mean will help you tremendously in your rotations and beyond.
VITALS
- Respiratory rate (Adult) — 12 – 20 breaths/min
- Heart Rate (Adult) — 60 – 80 bpm
- BP — 120/80 (Normal). 140/90 (Hypertension)
- T — 98.6 F
- BMI — 18.5 – 24.9 normal. 25 – 29.9 overweight. >30 obese. <18.4 underweight.
COMPLETE BLOOD COUNT
- RBC — Females: 3.5 – 5.5 million/mm3. Males: 4.3-5.9 million/mm3.
- WBC – 4500 – 11,000/mm3
- Hb — Females: 12 -16g/dL. Males: 13.5 – 17.5 g/dL.
- Hct — Females: 36 – 46%. Males: 41 – 53%.
- MCV — 80 – 100 um3
- MCH — 25.4 – 34.6 pg/cell
- MCHC — 31 – 36%
- Platelet — 150,000 – 400,000/mm3
- Reticulocyte count – 0.5 – 1.5%
WBC DIFFERENTIAL
- Segmented Neutrophils – 54 – 62%
- Band Neutrophils – 3 – 5%
- Eosinophils — 1 – 3%
- Lymphocytes — 25 – 33%
- Monocytes — 3 – 7%
BASIC METABOLIC PANEL
- Na – 135 – 147 meq/L
- K — 3.5 – 5.0 meq/L
- Cl — 95 – 105 meq/L
- Bicarbonate – 22 – 28 meq/L
- BUN – 7 – 18 mg/dl
- Creatinine — 0.6 – 1.2 mg/dL
- Glucose — Fasting: 70 – 110 mg/dL. 2-hr Postprandial: <120
- Calcium — 8.4 – 10.2 mmol/L
BLOOD GASES
- PaO2 — 75 – 105 mmHg
- PaCO2 — 33 – 45 mmHg
- pH — 7.35 – 7.45
LIVER FUNCTION TEST
- Aspartate Aminotransferase (AST) – 8 – 20 U/L
- Alanine Aminotransferase (ALT) – 8 – 20 U/L
- Lactate Dehydrogenase (LDH) — 45 – 90 U/L
- Bilirubin Total/Direct — 0.1 – 1 / 0.0 – 0.3 mg/dL
- Alkaline Phosphatase (ALP) – 20 – 70 U/L
PANCREATIC ENZYMES
- Amylase – 25 – 125 U/L
- Lipase – <95 U/L
OTHERS
- Prothrombin Time (PT) — 11 – 15 seconds
- Triglyceride — 35 – 160 mg/dL
FORMULAS TO KNOW
- Correction Calcium Levels
- Winter’s Formula
- Light Criteria
- Anion Gap — 8-16 normal.
RELATIONSHIPS TO KNOW
- BUN/Cr > 20 means its pre-renal AKI
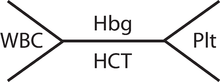
FISHBONE DIAGRAMS
Learn how to write your lab values like this: